Conversation Tracing
Conversation tracing groups the traces from a multi-turn session into a single thread, so you can navigate every turn and agent handoff in one view alongside the full multi-agent interaction graph.
How It Works
When your application runs a multi-turn test or a live chat session, Rhesis links all spans from that session using a shared conversation_id. The trace viewer then surfaces a dedicated Conversation tab that lets you navigate the full interaction thread — turn by turn, with the underlying span hierarchy always one click away.
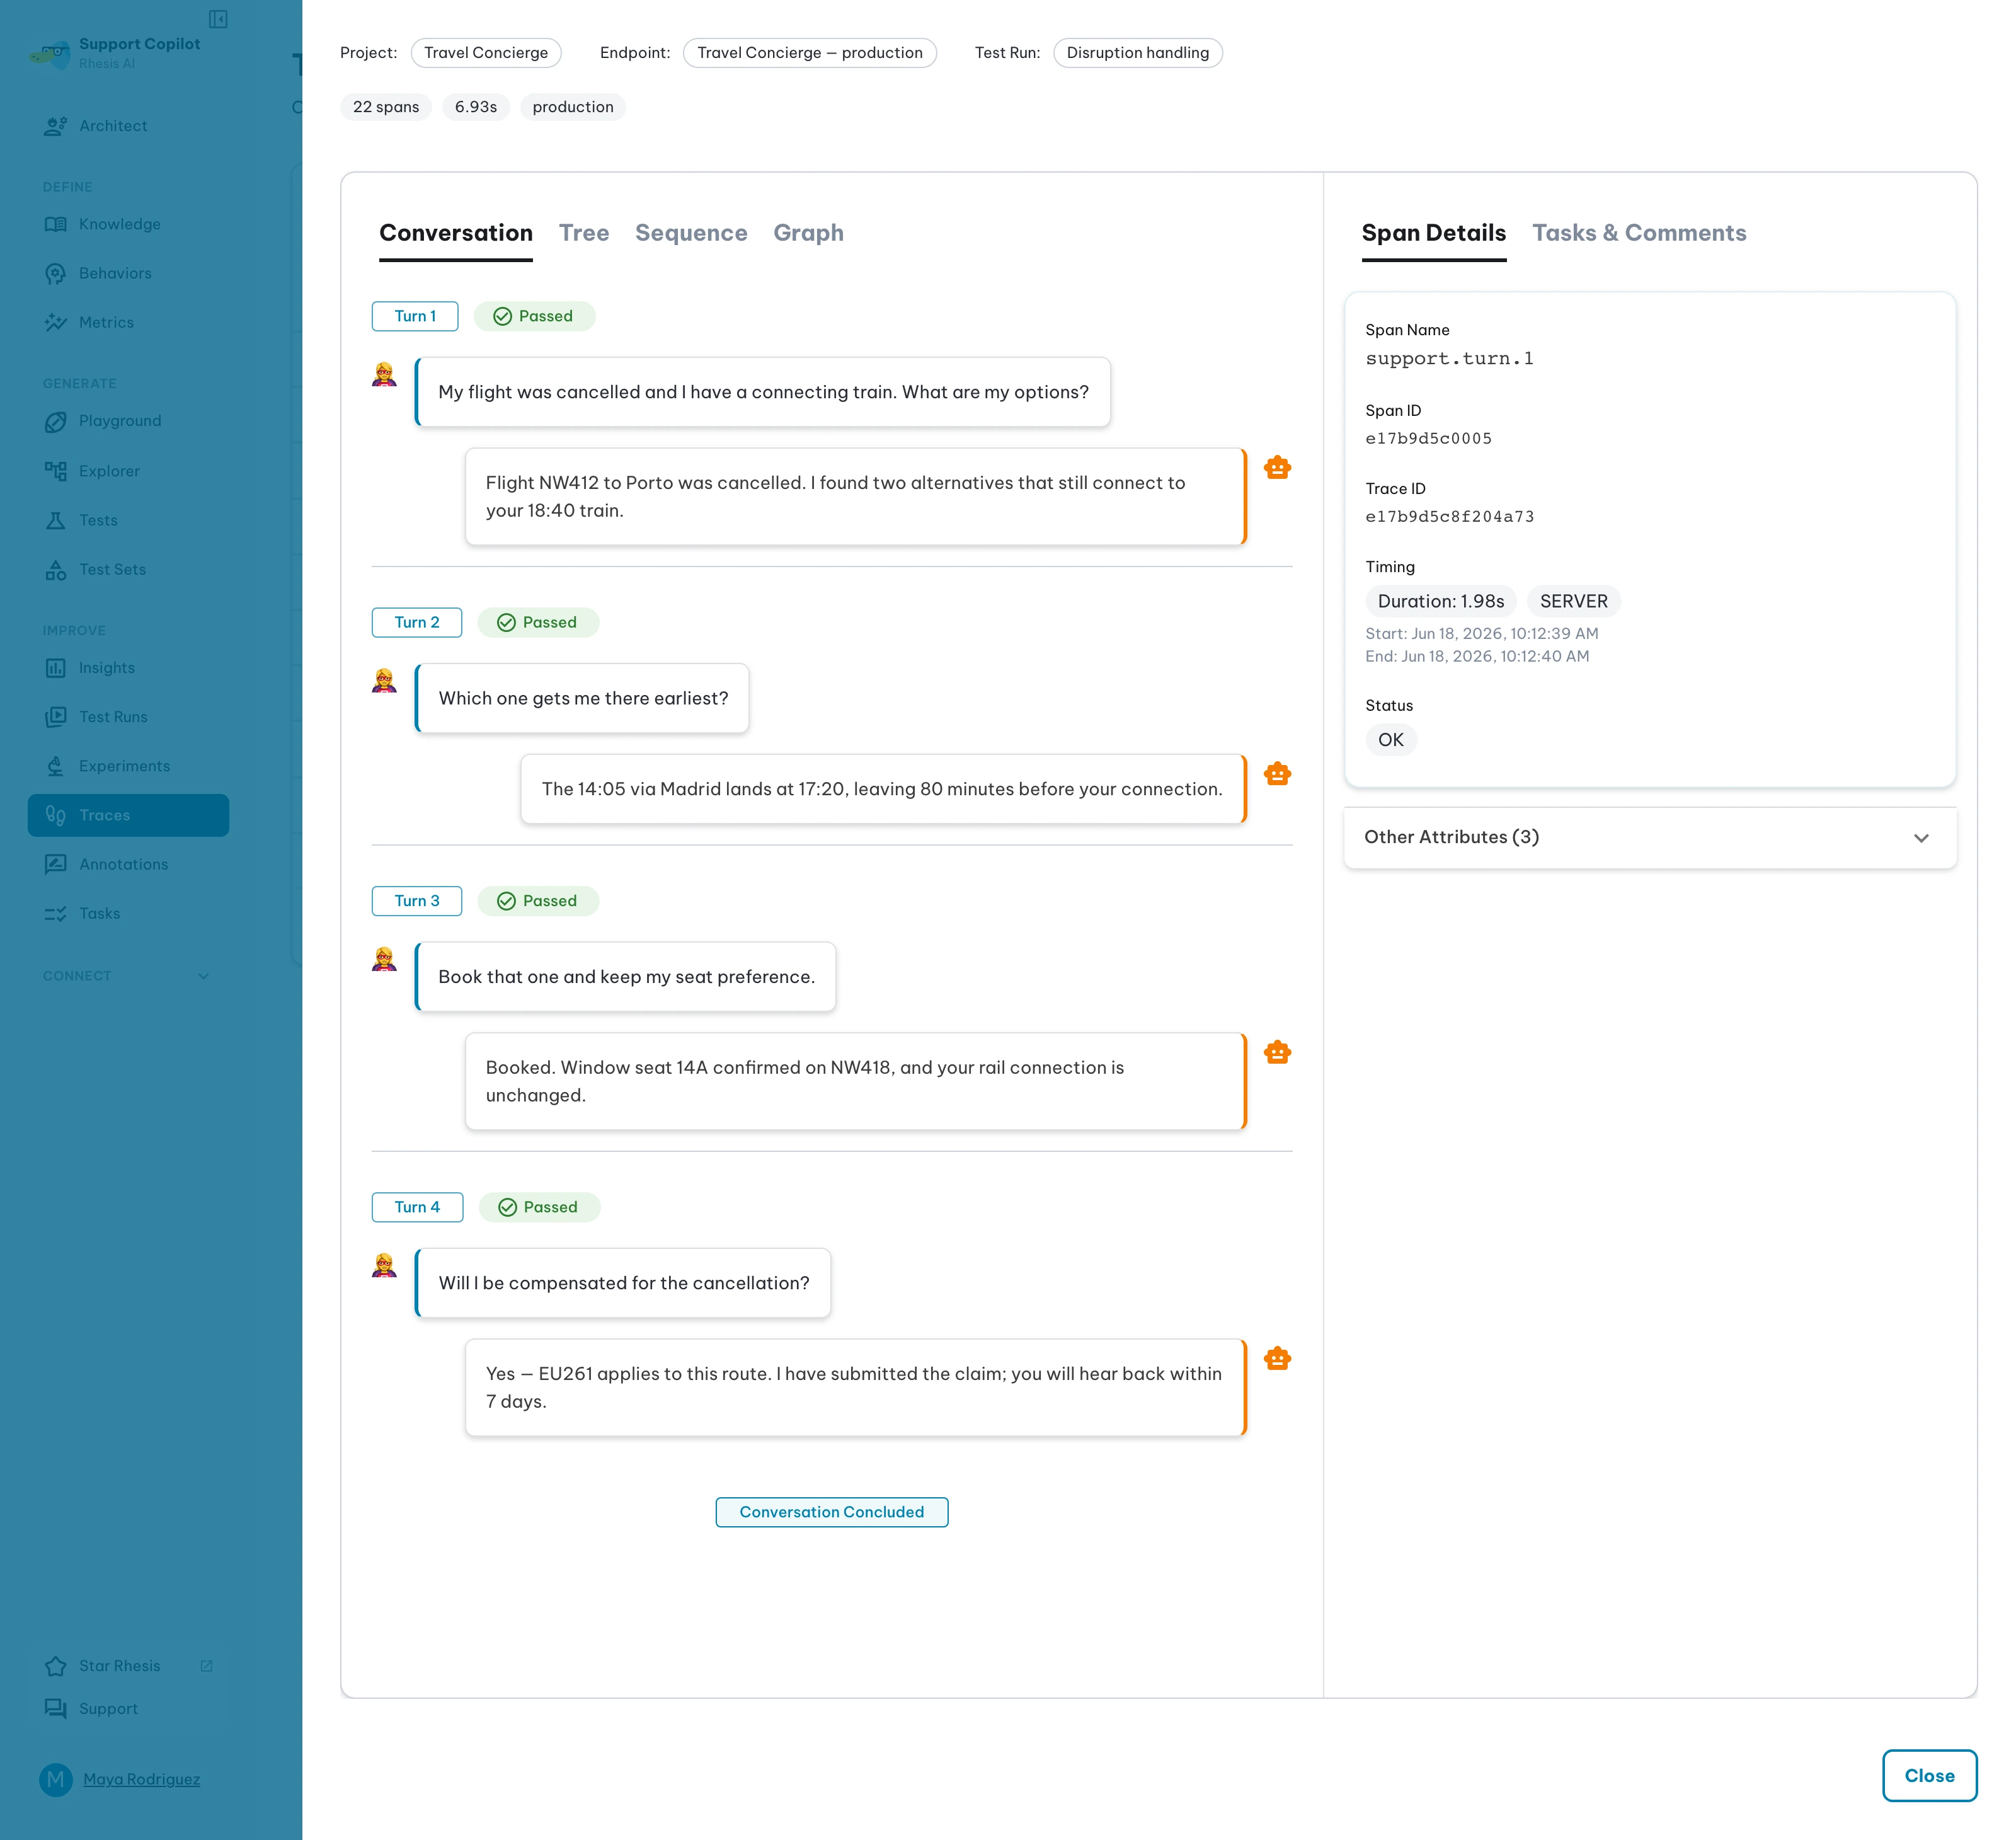
This works for two scenarios:
- Test-linked traces — when a conversation is executed as a Rhesis test, the conversation summary and goal evaluation are loaded from the test result
- Direct invocations — when you call an endpoint directly via the SDK, Rhesis reconstructs the conversation thread from the span attributes on each turn
Views
The trace detail page has three views for navigating a conversation trace.
Conversation View
Shows the full dialogue between the tester and your application, turn by turn. Each turn displays the input message, the response, any file attachments, and the pass/fail status for that turn. Click a response to jump directly to its span in the tree.
Tree View and Sequence View
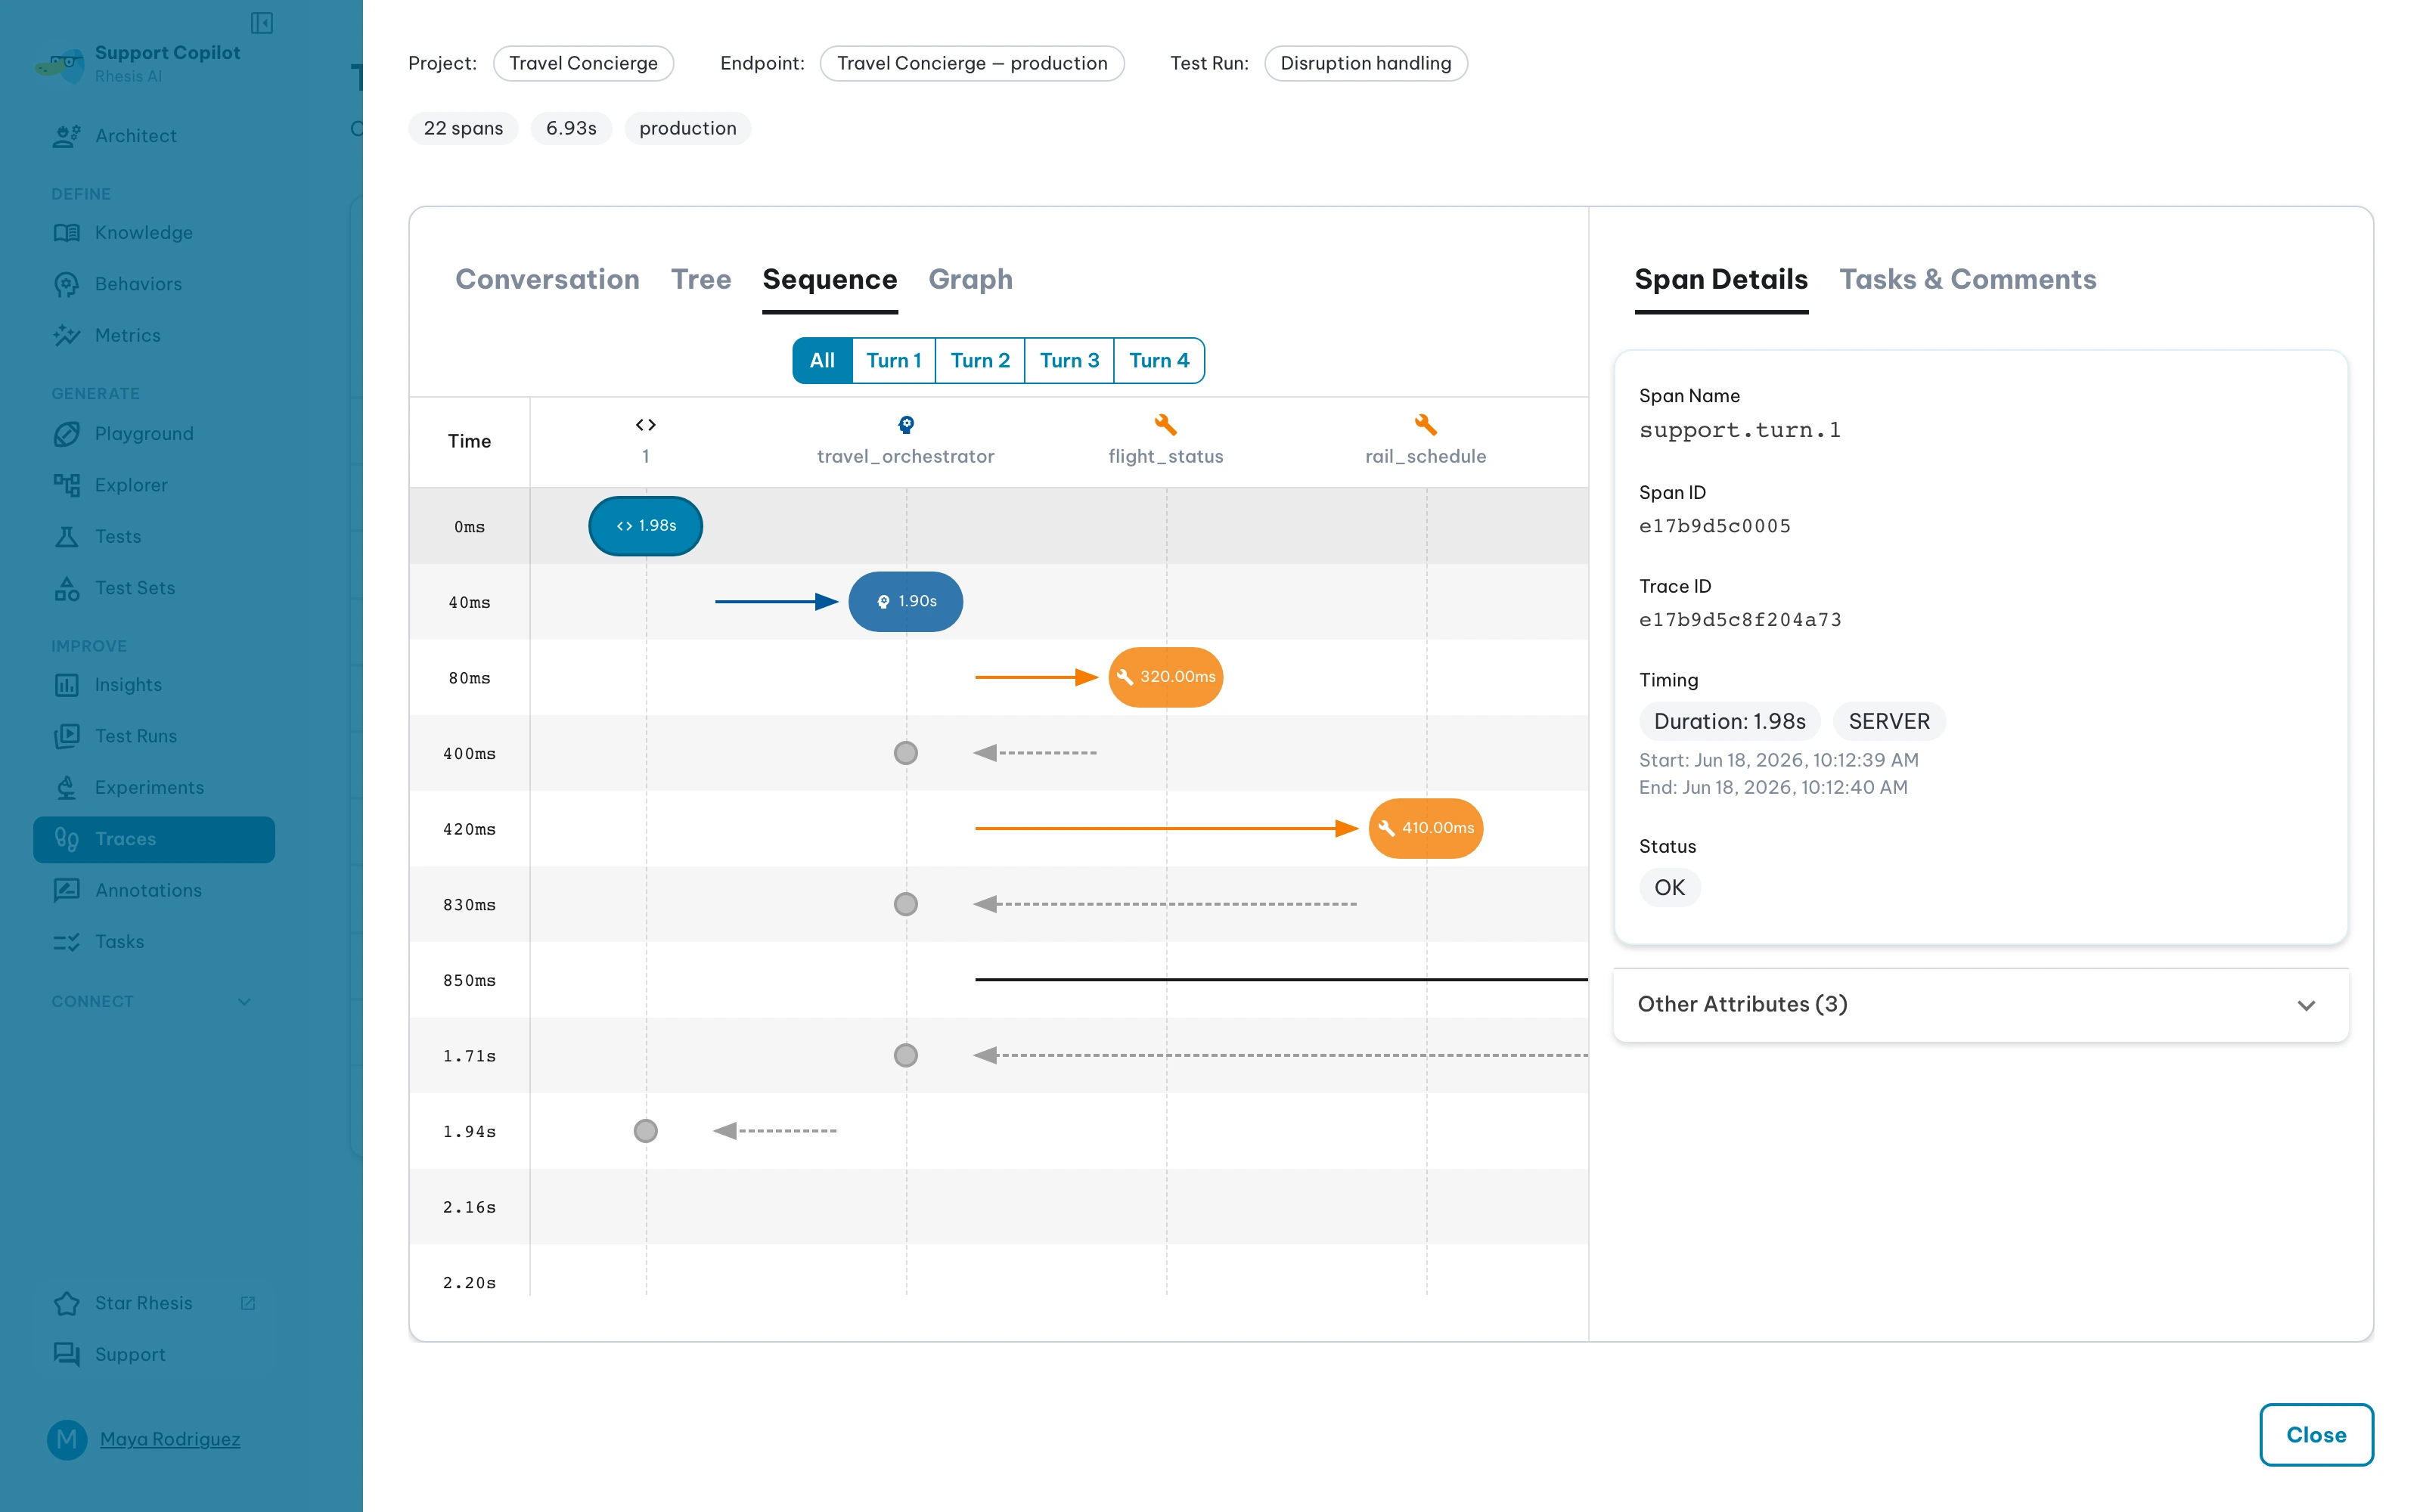
Standard OpenTelemetry views — span hierarchy with timing for Tree, chronological waterfall for Sequence. Both support turn-based navigation so you can jump between turns while staying in context.
Graph View
Visualizes the full multi-agent interaction as a directed graph. Nodes represent agents and tools; edges represent invocation and handoff relationships. Graph playback controls let you replay execution over time, with turn markers (T1, T2, …) showing when each conversation turn occurred.
Use the Graph View when debugging complex agent interactions — it makes routing decisions and handoff sequences immediately visible. See Multi-Agent Tracing for an example of what the graph looks like.
Enabling Conversation Grouping
To group traces into a conversation thread, pass a consistent conversation_id across all turns of the session. The Rhesis SDK handles this automatically when running tests. For direct invocations, set it via the endpoint context:
The session_id field in the response is mapped to conversation_id internally — they refer to the same concept. When the same session_id is returned across turns, Rhesis links all spans into a single conversation thread.
LangGraph: thread_id
A LangGraph app that already checkpoints its turns under a thread_id needs nothing extra. When no conversation id is bound, the LangGraph integration uses that thread_id, so the turns of one thread arrive as a single trace:
An id bound explicitly — by a test run, by @endpoint, or by conversation_turn below — takes precedence over thread_id.
Standalone Apps: Owning the Turn
Behind @endpoint the turn root is the endpoint span and Rhesis fills in the reply from the mapped response, so there is nothing more to do. A standalone run has no endpoint — a terminal chat, a script, a worker — and there the framework integration has to guess the turn’s reply from the model spans it can see. That works when the reply is the model’s last message. It does not when your app composes the reply itself: from a tool result, from a template, from its own branching. That text appears in no span, and the agent framework’s run span has already ended by the time your code holds it, so nothing downstream can recover it.
conversation_turn closes that gap. It opens a span that outlives the agent run, so the reply can be recorded after the fact:
That one block replaces any manual set_conversation_id call. It binds the conversation id, marks the span as the turn root with the message and the reply, and puts every turn of the conversation on a single trace — the first turn keeps its own trace id and later turns join it.
Pass name= to label the turn in the viewer (name="function.my_agent_turn"). The name must start with function. or be a valid ai.* operation, or the backend rejects the span.
It is safe to leave in place everywhere. When a Rhesis span above it already owns the turn root — behind @endpoint or @observe, or in any platform-driven turn — conversation_turn binds the conversation id and opens no span, because two spans claiming the turn root in one exchange detaches one subtree into a phantom turn. With tracing switched off it is a no-op that still yields a usable turn, so your code never branches on whether tracing is configured.
Why a Trace Can Look Incomplete for a Moment
Opening a trace the instant a turn finishes can show a couple of child spans and no conversation data. Spans are batched and exported every 5 seconds, and the turn root is the outermost span, so it ends last and ships in a later batch than its children. Until it arrives there is no span carrying the conversation attributes. Re-opening the trace a moment later shows the full picture — the view is fetched on open, and enrichment runs asynchronously after ingest.
Filtering Traces
In the Traces dashboard, use the trace type filter to focus on conversation traces. The filter separates single-turn and multi-turn traces so you can quickly find sessions with multiple turns or specific conversation IDs.
Related:
- Multi-Agent Tracing — instrument agent handoffs
- Decorators —
@observeand@endpoint - Auto-Instrumentation — zero-config tracing for LangGraph