Reports and Charts
Architect answers questions about your test data with charts: pass rates, breakdowns by topic or requirement, trends over time, and comparisons between runs or endpoints. Ask in plain language and it picks the breakdowns, draws a chart for each, and says what each one shows.
"Give me a report on pass rates by topic, and how they changed week by week over the last two months."
"Which five requirements fail most often? Ignore ones with fewer than ten results."
"Compare our two endpoints across all metrics."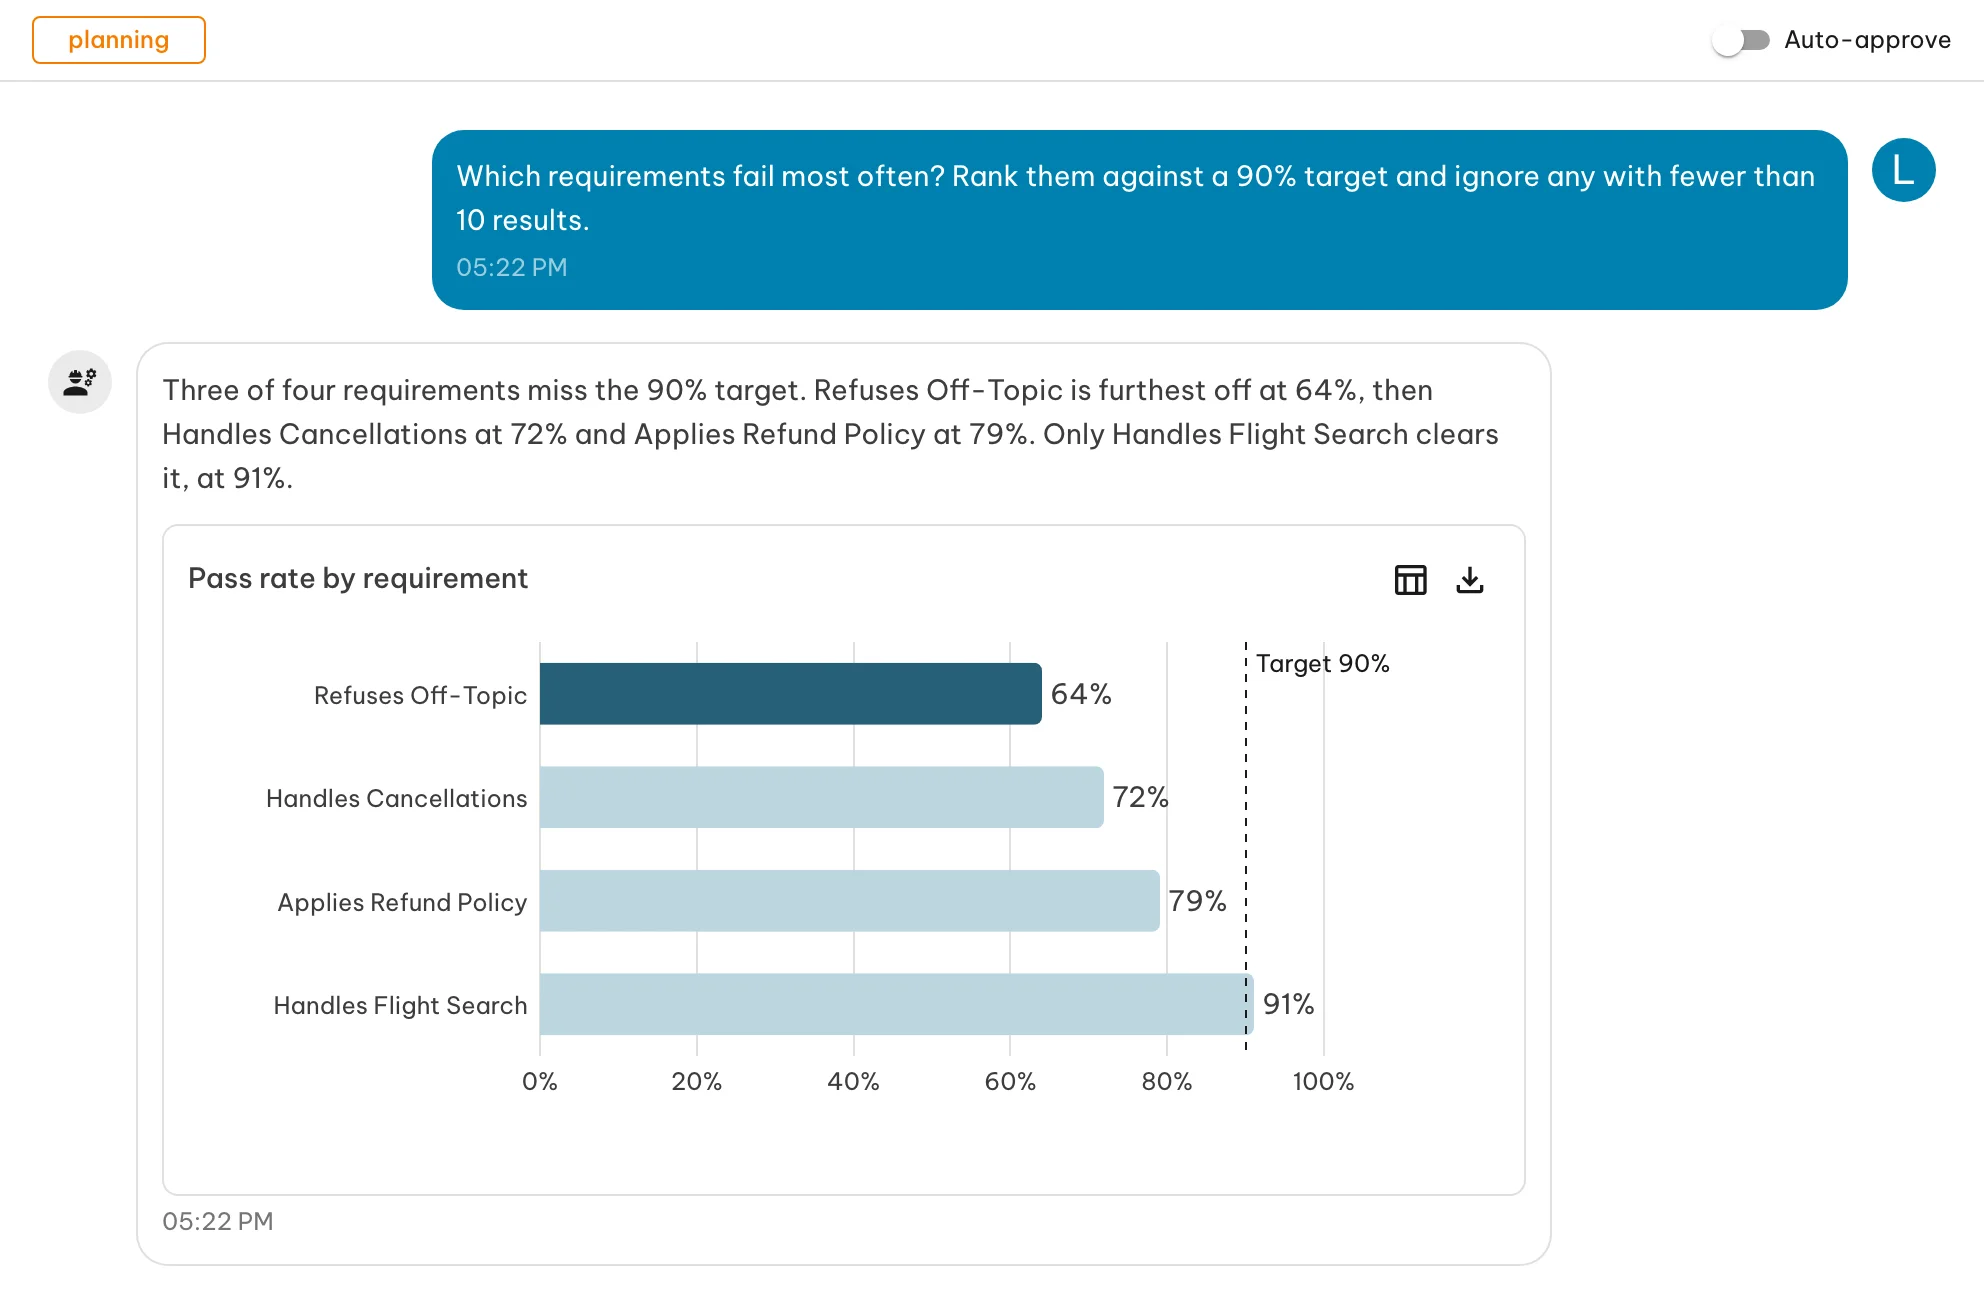
Where the numbers come from
Every chart is drawn from a query against your data, the same one behind the Insights page, so the two always agree. Architect chooses what to chart; it never writes the numbers itself. Each chart has a Show data toggle that switches it to a table of the exact values.
Export downloads a chart as a PNG image or an SVG, with its title and legend, or its rows as a CSV file. Tables and headline numbers export as CSV only.
Reading a chart
Charts use shades of teal: a pale teal for context and a deeper teal for what the reply is about. When Architect’s answer names a value, such as the weakest topic or the run that regressed, that bar or line is drawn in the deeper teal and the rest stay pale. On a chart that already compares runs or endpoints, a highlighted topic keeps its bars and the other topics fade. Charts that compare two to four series give each its own shade, from dark to light, and name each one in the legend. A chart never shows more than four series; for more, Architect narrows the question or uses a heat table. Pass and fail shading in heat tables keeps its usual green and red.
A chart shows at most 200 rows. When a breakdown has more, the chart says so; narrow the question (a shorter date range, fewer runs, or a top-N) to see the rest.
What you can ask
| Question | Chart |
|---|---|
| How has the pass rate moved over time? Per endpoint or test set? | Line, one line per endpoint or test set |
| How did passed, failed and errored results change over time? | Stacked area |
| Which topics, requirements or metrics are weakest? | Horizontal bars, sorted, optionally against a target |
| How do categories compare? | Bars |
| What share of each run passed, failed or errored? | Stacked bars |
| Which topics got worse between two runs? Which metric fails on which topic? | Heat table: one row per topic, one column per run or metric, cells shaded from red to green |
| Do topics with more tests pass less often? | Scatter, one point per topic |
| How do two endpoints compare across all metrics? | Radar, one shape per endpoint |
| What is the overall pass rate? | A single headline number, optionally with a target |
| How has p95 latency or LLM cost moved day by day? Per environment? | Line, one line per environment |
| How long do runs take, per test set or endpoint? | Horizontal bars of average or p95 run duration |
| Which operations error most often? | Horizontal bars of error rate |
Breakdowns are available by requirement, category, topic, test run, test set, endpoint, who started the run, status, and time (by day, week, month, quarter or year). For metrics, Architect can chart pass rates and average, minimum and maximum scores per metric. For traces, it can chart latency (average and percentiles), tokens, cost in USD and error rate by environment, operation, test run, endpoint and time. The full list is in the SDK Insights reference.
When Architect ranks rates, it leaves out groups with too few results to be meaningful, so a topic with one passing test doesn’t top the list.
Reloading a session
Charts are saved with the reply. Reopening a session shows them as they were drawn, from the data at the time of the question. Ask again for current numbers.